format_data <- data.frame(name = c("Evelyn", "Grace", "Juan", "Alex", "Monica", "Sriya"),
                 group = c("pdf", "pdf", "pdf", "website", "website", "website"),
                 understanding = c("deep", "shallow", "deep", "deep", "shallow",
                                   "shallow"),
                 major = c('Statistics', 'Economics', 'Economics', 'Statistics',
                           'Economics', 'Statistics'),
                 GPA = c(3.81, 3.63, 3.20, 2.85, 3.19, 3.80),
native_speaker = c('Yes','No','Yes','No','Yes','Yes'))Randomized Experiments
Principles of experimental design
WarningThis page covers…
cobaltlibrary- drawing the love plot
- testing for covariance imbalance
Ideas in Code
You won’t need to learn a lot of new code in this unit because most of the heavy lifting will be done by methods learned in the generalization unit. Here we’re gonna learn how to use the cobalt library to check for covariate imbalance.
Covariate balance with cobalt
First we create a data frame to store the pdf vs. website data.
The cobalt package in R contains the function bal.tab to create tables of standardized differences. By passing its output to plot you can create a Love plot. Note that cobalt expect treatment variables to be numeric or logical, so we begin by converting group to the logical variable is_website.
library(cobalt)
format_data <- format_data |>
                mutate(is_website = group == 'website')

bal.tab(is_website ~ major + GPA + native_speaker, data = format_data,
        s.d.denom = 'pooled', binary = 'std') |>
  plot()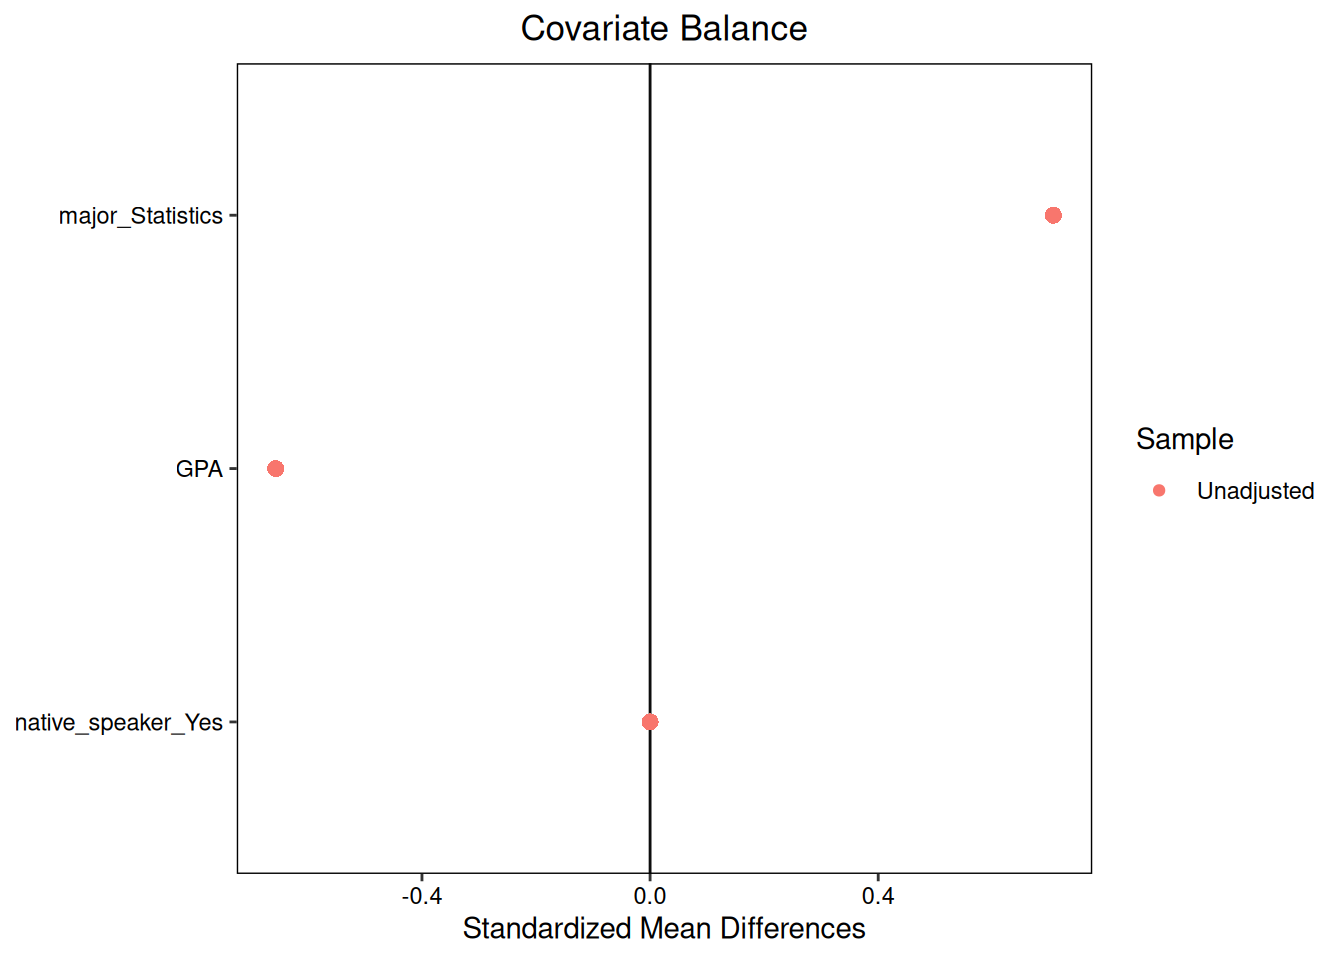
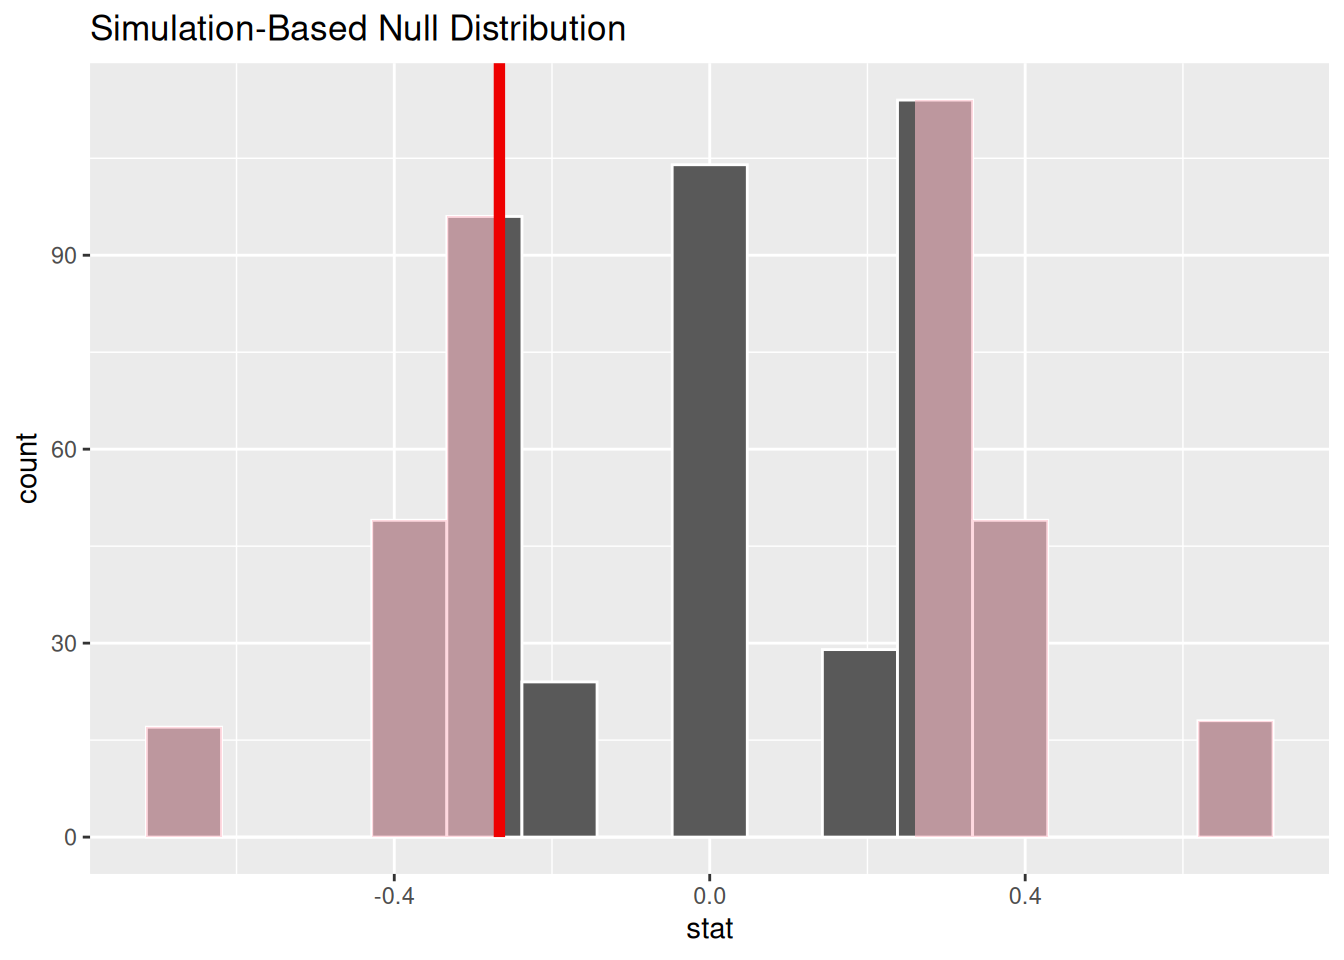
Running balance tests uses infer much like we did in the generalization unit. The covariate for which we are testing balance is the response and the treatment is the explanatory variable.
library(infer)
set.seed(2024-3-25)
obs_stat <- format_data |>
   specify(explanatory = group,
          response = GPA) |>
  calculate(stat = "diff in means", order = c("website","pdf"))

null <- format_data |>
  specify(response = GPA,
          explanatory = group) |>
  hypothesize(null = "independence") |>
  generate(reps = 500, type = "permute") |>
  calculate(stat = "diff in means", order = c("website","pdf"))

null |>
  visualize() +
  shade_p_value(obs_stat, direction = 'both')