02:00
Defining Causation
STAT 20: Introduction to Probability and Statistics
Warmup
05:00
05:00
A spiderweb of causes
Suppose there is Stat 20 class tomorrow. The professor has prepared the warmup. The Reader will print the warmup sheets. The 3 Tutors will hand out the sheets. Now, imagine you are in class and have a warmup sheet in your hands. (Call this event “S”)
Using the conditional counterfactual definition, what caused you to have the warmup sheet in your hands?
“P”: The Professor preparing the sheet.
“R”: The Reader printing the sheets.
“T1”: Tutor 1 handing out the sheets.
“T2”: Tutor 2 handing out the sheets.
“T3”: Tutor 3 handing out the sheets.
“C”: You coming to class on time.
A spiderweb of causes: answer
flowchart LR
    P((P)) --> R((R))
    R --> T1((T1))
    R --> T2((T2))
    R --> T3((T3))
    T1 --> J1
    T2 --> J1
    T3 --> J1
    J1 -.- J2
    C((C)) -.- J2
    J2 --> S((S))

    style J1 fill:none,stroke:none,color:transparent,width:0px,height:0px
    style J2 fill:none,stroke:none,color:transparent,width:0px,height:0px
solid line means “A is enough for to B happen”, dashed line means “A is needed for B to happen”
The following events are all causes for \(S\):
- \(P\)
- \(R\)
- \(C\)
- \(T1\) or \(T2\) or \(T3\)
But not \(T1\) by itself, because, if \(T1\) hadn’t happened, \(S\) would have still happened!
Concept Questions
Prof. Biegschott or Prof. Nobbo-Dee?
Sci 101 (Introduction to Galaxy-Brain Ideas) has two sections: one taught by Prof. Biegschott (treatment), the other by prof. Nobbo-Dee (control). Testing is shared. Imagine we know the final score of the following students if they took the class with the different profs.
| Name | Score with prof. B (\(Y_t\)) | Score with prof. N (\(Y_c\)) |
|---|---|---|
| Maria | 73% | 77% |
| Fan | 60% | 64% |
| Durga | 80% | 95% |
| Muhammad | 69% | 70% |
Prof. Biegschott or Prof. Nobbo-Dee?
| Name | Score with prof. B (\(Y_t\)) | Score with prof. N (\(Y_c\)) |
|---|---|---|
| Maria | 73% | 77% |
| Fan | 60% | 64% |
| Durga | 80% | 95% |
| Muhammad | 69% | 70% |
Enrolling in prof. Biegschott’s section will cause Durga to score ___ more/less than enrolling in prof. Nobbo-Dee’s section.”
The Individual Treatment Effect for Durga is \(Y_t - Y_c = 80\% - 95\% = -15\%\)
01:00
Prof. Biegschott or Prof. Nobbo-Dee?
| Name | Score with prof. B (\(Y_t\)) | Score with prof. N (\(Y_c\)) |
|---|---|---|
| Maria | 73% | 77% |
| Fan | 60% | 64% |
| Durga | 80% | 95% |
| Muhammad | 69% | 70% |
What’s the Average Treatment Effect for this (tiny) population?
ATE \(= E(Y_t - Y_c) = \frac1{4} \left(-4\% -4\% -15\% -1\%\right) = -6\%\)
Prof. Biegschott or Prof. Nobbo-Dee?
Eh, but we’re never gonna observe both potential outcomes. Instead:
| Name | Score with prof. B (\(Y_t\)) | Score with prof. N (\(Y_c\)) |
|---|---|---|
| Maria | 73% | ? |
| Fan | ? | 64% |
| Durga | 80% | ? |
| Muhammad | ? | 70% |
Prof. Biegschott or Prof. Nobbo-Dee?
Eh, but we’re never gonna observe both potential outcomes. Instead:
| Name | Professor (\(D\)) | Score (\(Y\)) |
|---|---|---|
| Maria | Biegschott (1) | 73% |
| Fan | Nobbo-Dee (0) | 64% |
| Durga | Biegschott (1) | 80% |
| Muhammad | Nobbo-Dee (0) | 70% |
How would you have tried to calculate the average treatment effect?
\(E(Y|D=1) - E(Y|D=0) = \frac1{2} \left(73\% + 80\%\right) - \frac1{2} \left(64\% + 70\%\right) = 76.5\% - 67\% =+9.5\%\)
Prof. Biegschott or Prof. Nobbo-Dee?
Why is this calculation of the average treatment effect so completely contrary to the one before? Who’s the better professor?
For some reason, students who would have scored higher anyway enrolled with Biegschott, even though they’d have benefitted from enrolling with Nobbo-Dee.
This is an example of Confounding, which is the new terrible enemy encountered in Causal studies.
Prof. Biegschott or Prof. Nobbo-Dee?
Why was there a tendency for higher scorers to enroll with Biegschott?
03:00
Who knows?
- maybe higher-scoring students are more obsessed with famous professors so they enrolled in their section?
- maybe we used a competitive method to select students for Biegschott’s section?
- maybe the higher-scoring students take a certain other class that conflicts with Nobbo-dee’s class?
Arguing about or avoiding all these scenarios and more is the bread and butter of Causality.
Break
05:00
Lab (Taste Test) - Part I
Finding a group
- Get into groups of 3 or 4! This will be your group for this week’s assignment.
- If someone you plan to have in your group is missing today, you must account for that in your total group size.
A Matter of Taste
Your challenge: Determine whether you can affect one your teammates’ perceptions of bubble water by manipulating their experience of tasting.
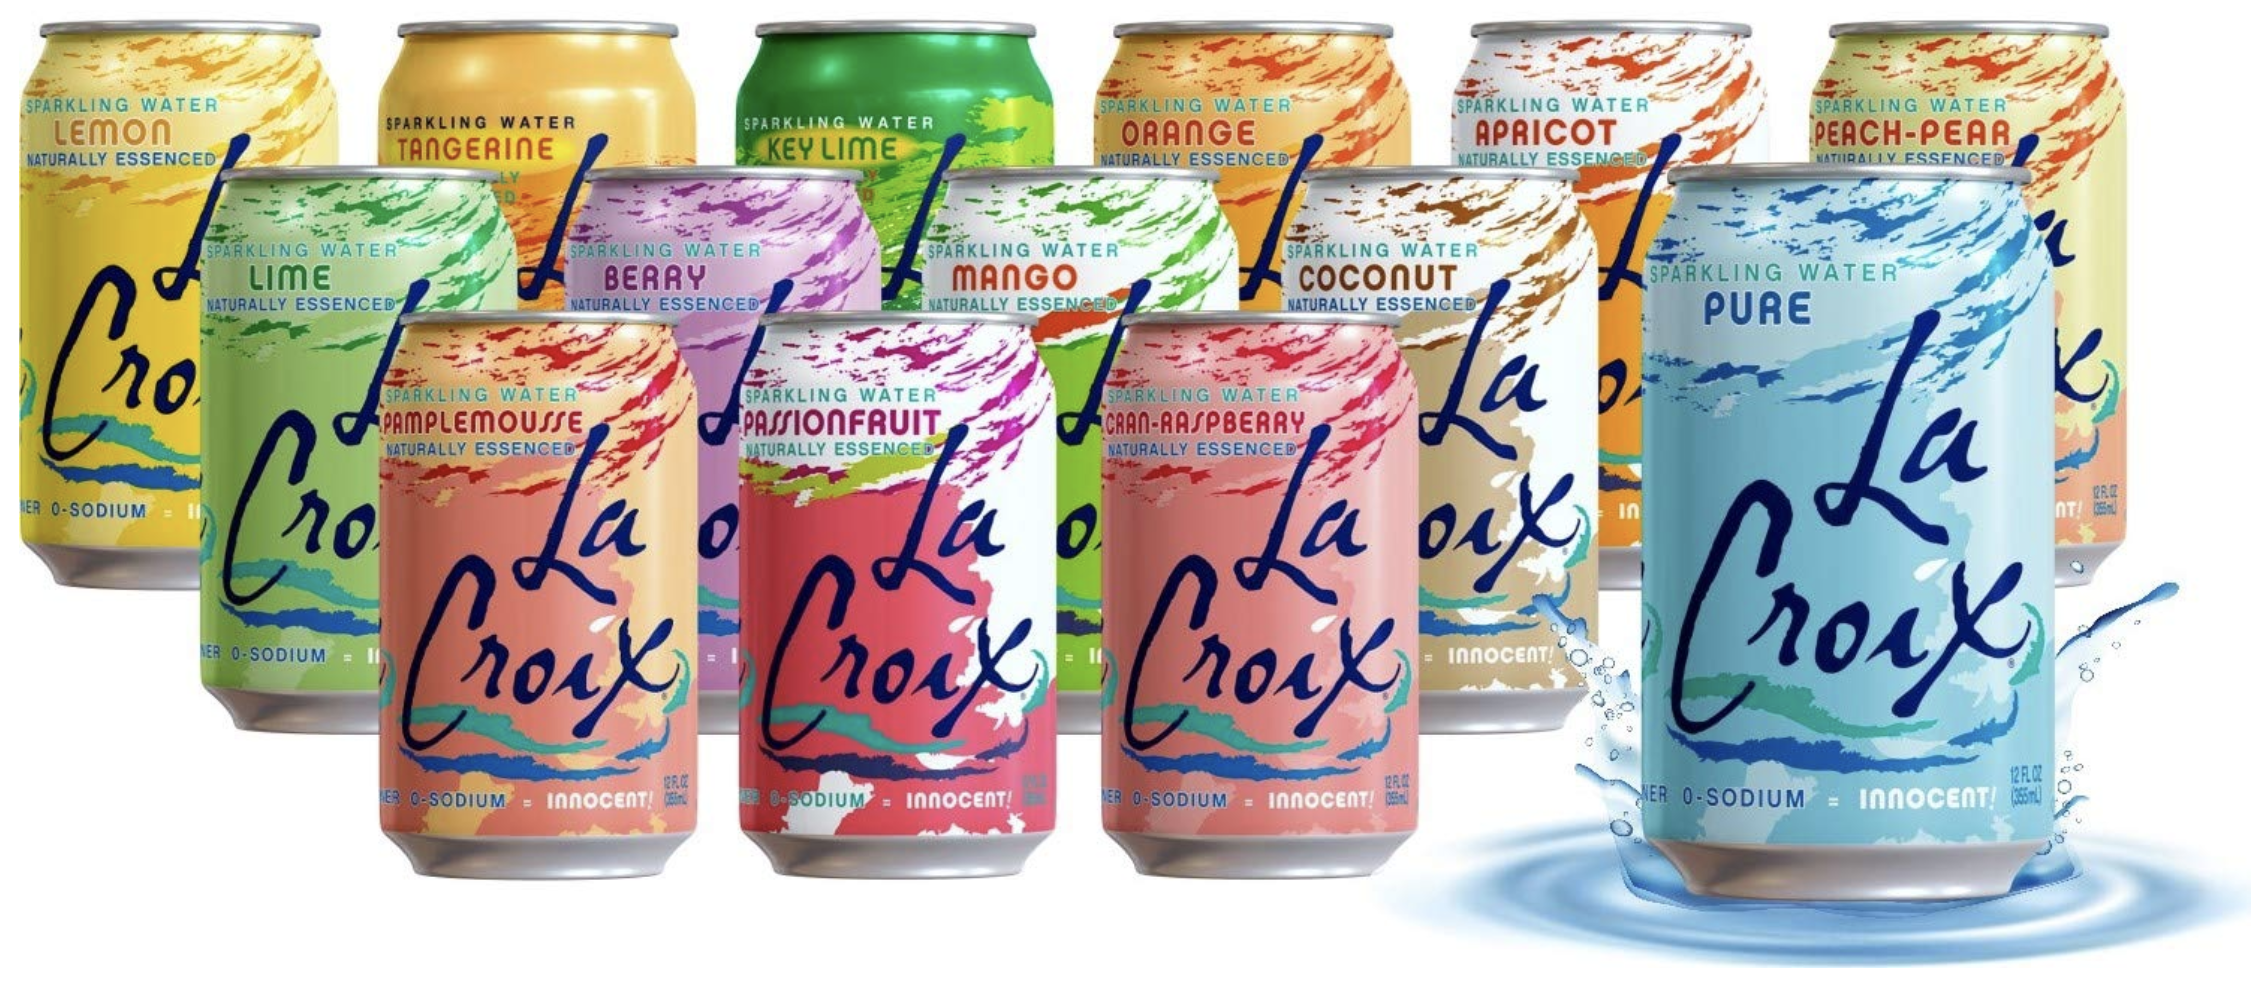
Each team will have access to
- 50 minutes (half of next class)
- 2 cans of soda water, each one from a different flavor
- small paper cups
- saltine crackers
- other materials welcome
Designating roles within your group
If you want, you can assign different roles among yourselves
- Taster/Subject: Undergoes the experiment, tastes soda water, provides data.
- Materials: Handles the materials (water et. al) for the experiment
- Facilitator(s): Carries out the experiment, keeps track of time, records data.
- Or something along these lines
Things to remember
- Be very precise in your protocol.
- Be sure your claim corresponds to your protocol corresponds to your data corresponds to your plots.
- Important: Your worksheet must be fully completed and shown to your instructor before you begin the experiment next class!
Lab (Taste Test) - Part I
40:00