# A tibble: 4 × 5
  name    hours cuteness food_eaten is_indoor_cat
  <chr>   <dbl>    <dbl>      <dbl> <lgl>
1 castiel    12      9          175 TRUE
2 frank      18     10          200 TRUE
3 luna       19      9.5        215 FALSE
4 luca 10 8 218 FALSE Improving Predictions and Overfitting
Which of the following models is most impressive to you?
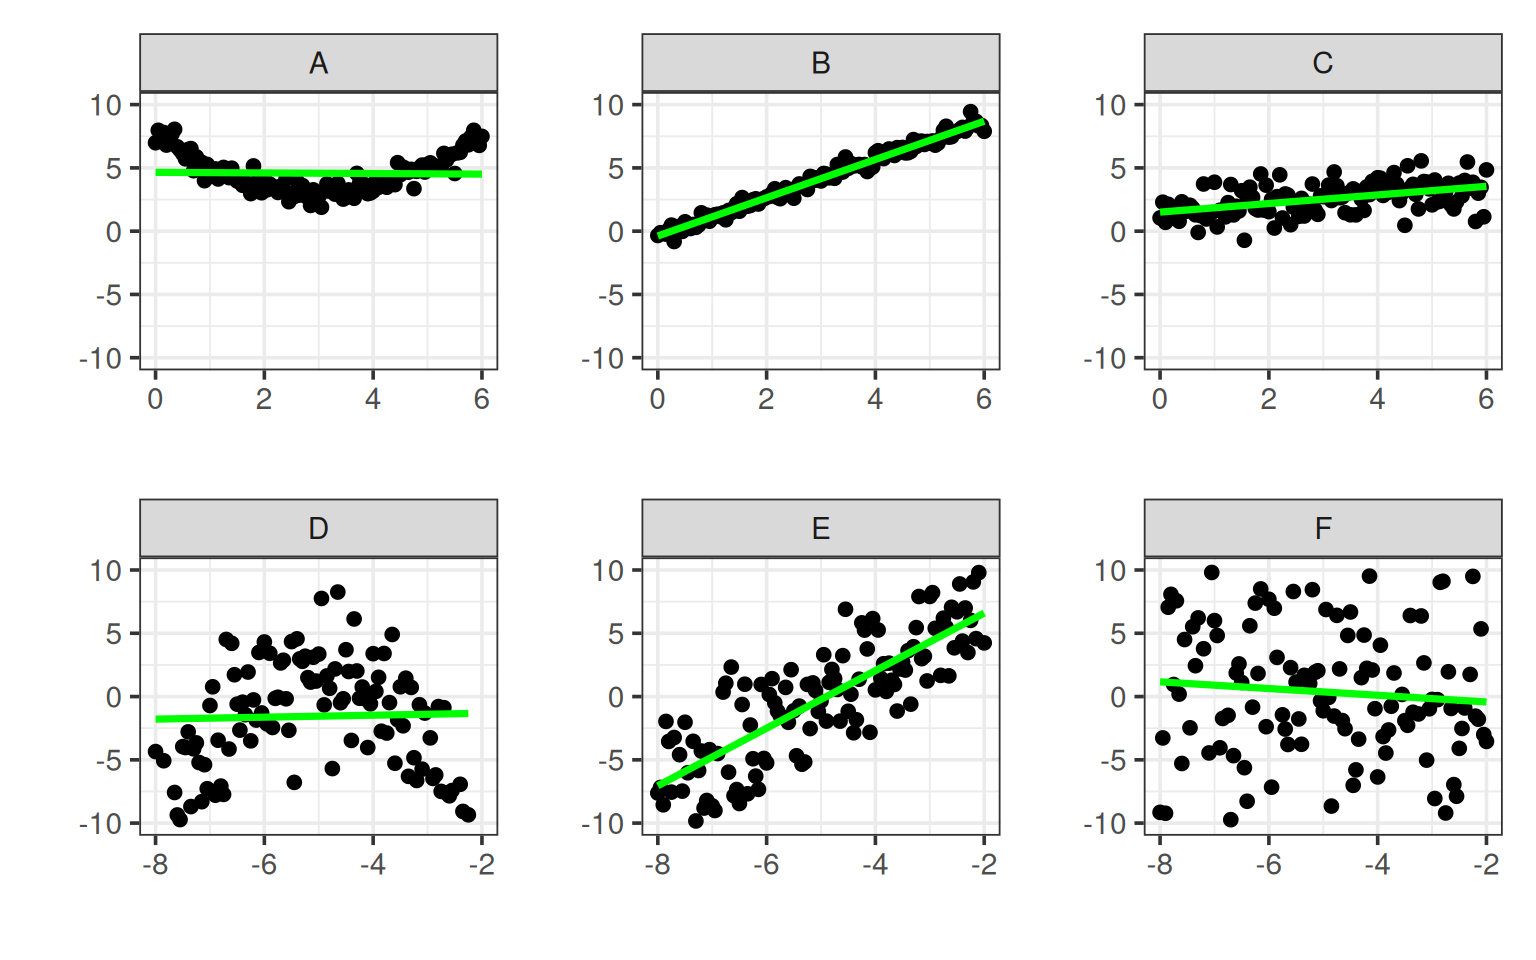
I’d say B is definitely the best but what’s after that?
Eyeball the sample RMSE and then MSE of the models.
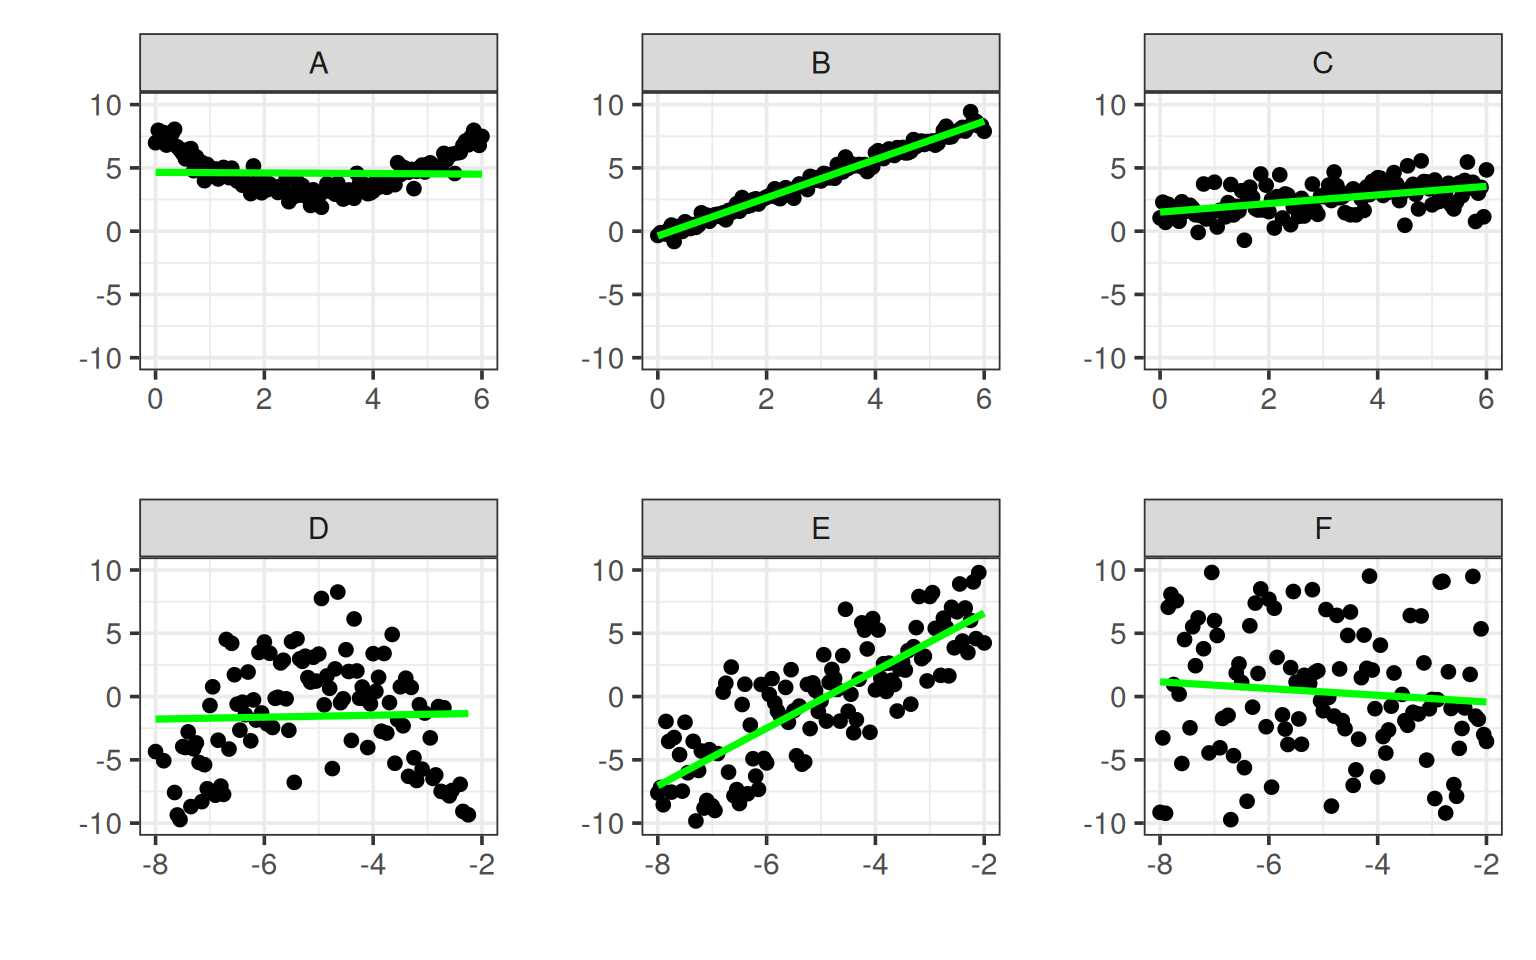
\[\widehat{\mbox{RMSE}}_A \approx 2 \Rightarrow \widehat{\mbox{MSE}}_A \approx 4, \; \widehat{\mbox{RMSE}}_B \approx 1 \Rightarrow \widehat{\mbox{MSE}}_B \approx 1, \; \widehat{\mbox{RMSE}}_C \approx 2 \Rightarrow \widehat{\mbox{MSE}}_C \approx 4 \\ \widehat{\mbox{RMSE}}_D \approx 5 \Rightarrow \widehat{\mbox{MSE}}_D \approx 25, \; \widehat{\mbox{RMSE}}_E \approx 3 \Rightarrow \widehat{\mbox{MSE}}_E \approx 9, \; \widehat{\mbox{RMSE}}_F \approx 7 \Rightarrow \widehat{\mbox{MSE}}_F \approx 49 \]
Eyeball the variance of the samples (i.e. the MSE of the baseline models).
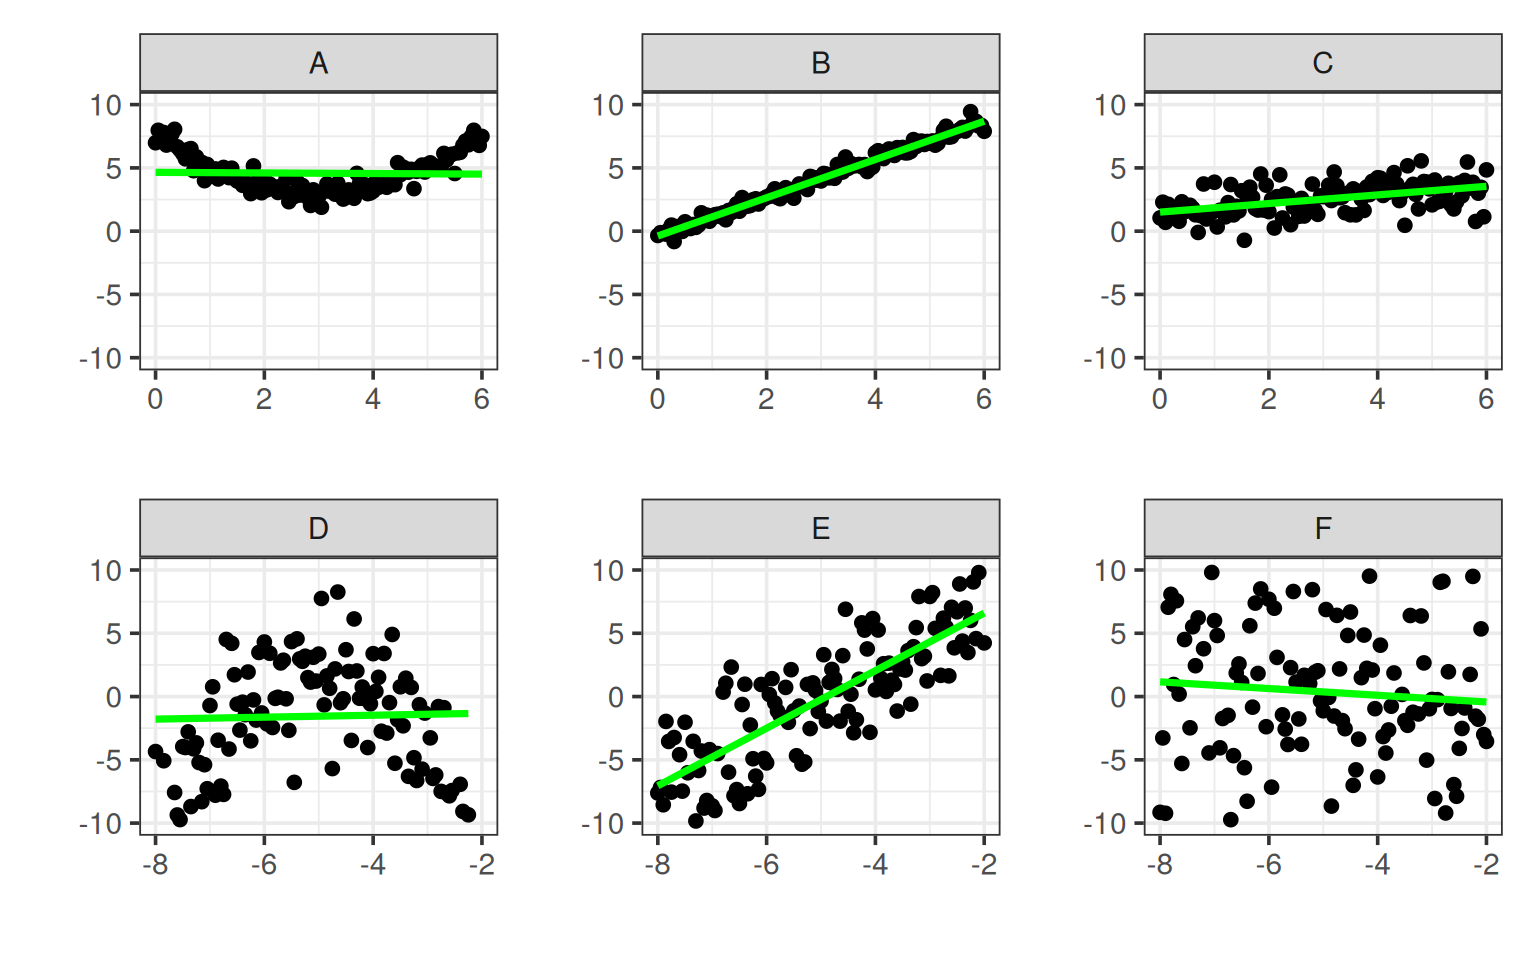
\[\widehat{\mbox{MSE}}_{\mbox{baseline}, A} \approx 2^2=4, \; \widehat{\mbox{MSE}}_{\mbox{baseline}, B} \approx 3^2=9, \; \widehat{\mbox{MSE}}_{\mbox{baseline}, C} \approx 2^2 = 4 \\ \widehat{\mbox{MSE}}_{\mbox{baseline}, D} \approx 5^2=25, \; \widehat{\mbox{MSE}}_{\mbox{baseline}, E} \approx 7^2=49, \; \widehat{\mbox{MSE}}_{\mbox{baseline}, F} \approx 7^2=49 \]
And finally the \(R^2\) are?
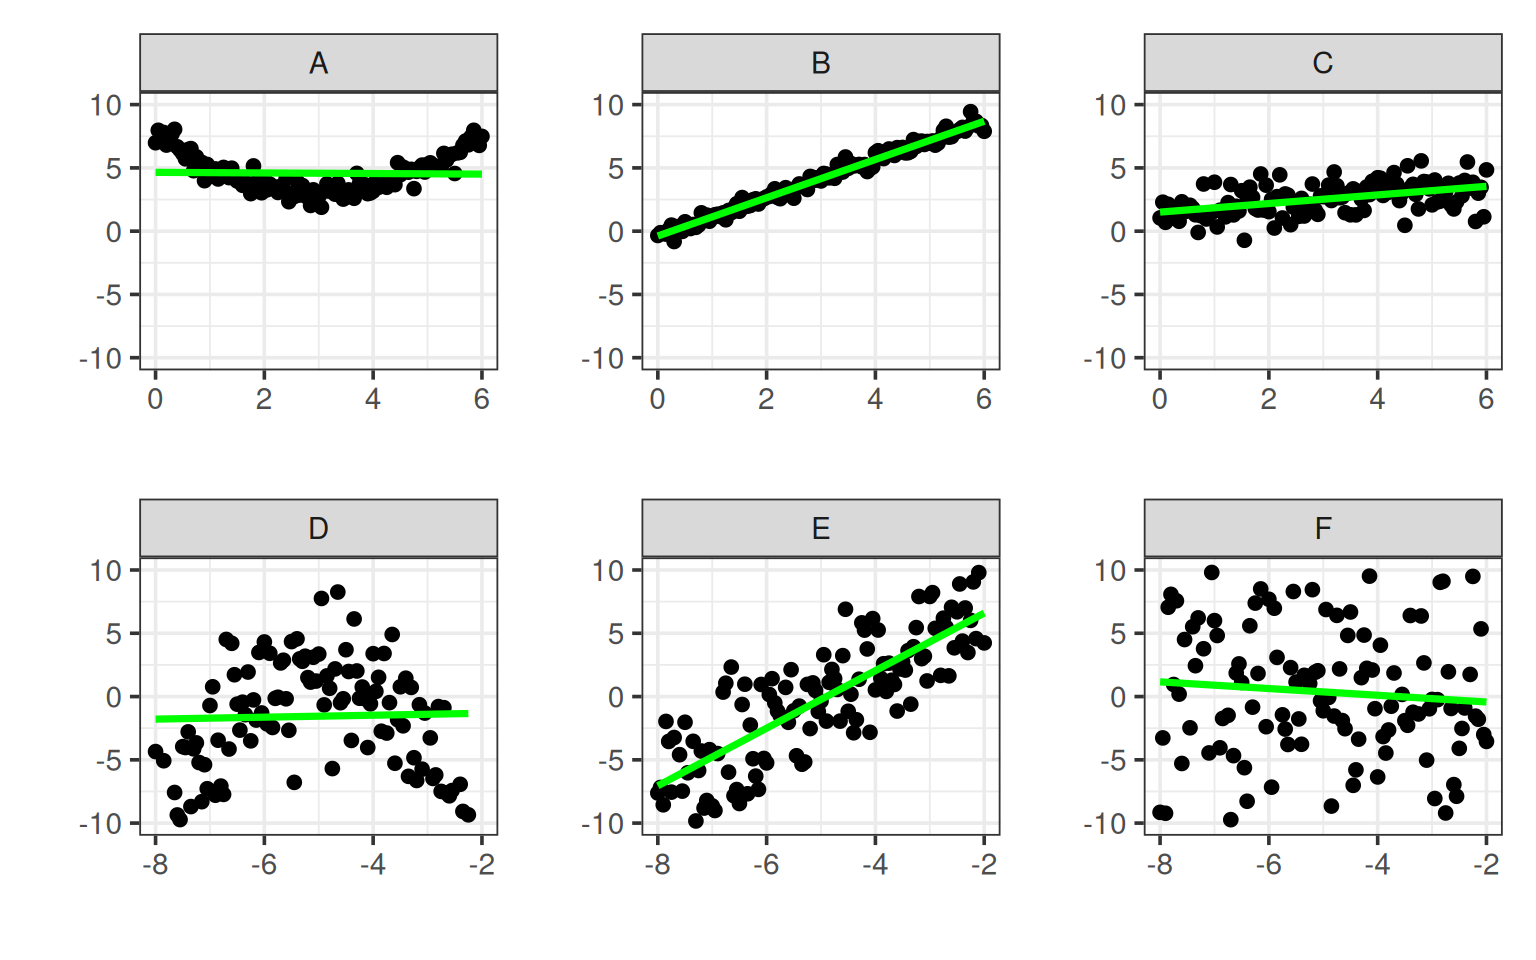
\[R^2_{A} \approx 0, \; R^2_{ B} \approx \frac{8}{9} \approx 0.9, \; R^2_{ C} \approx 0 \\ R^2_{D} \approx 0, \; R^2_{ E} \approx \frac{40}{49} \approx 0.8, \; R^2_{ F} \approx 0 \]
The models in A, C, D, F just don’t really do much better than baseline at all…
A and D because the function is bad. A curved function would do better. D and F just seem to have no interesting structure at all in them, it’s just bad data…
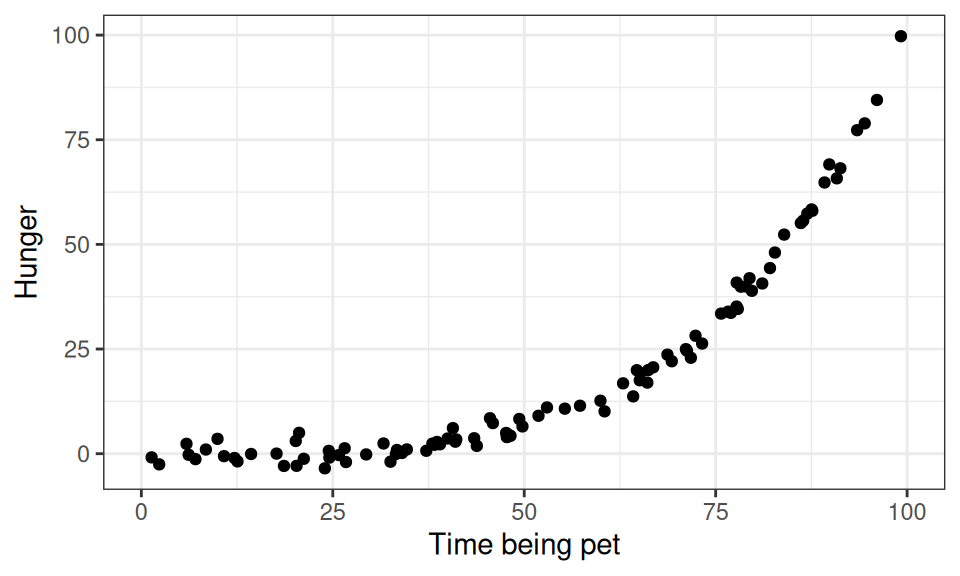
Using “time being pet”, which lm formula is most appropriate to predict hunger, based on the below visualization?
01:00
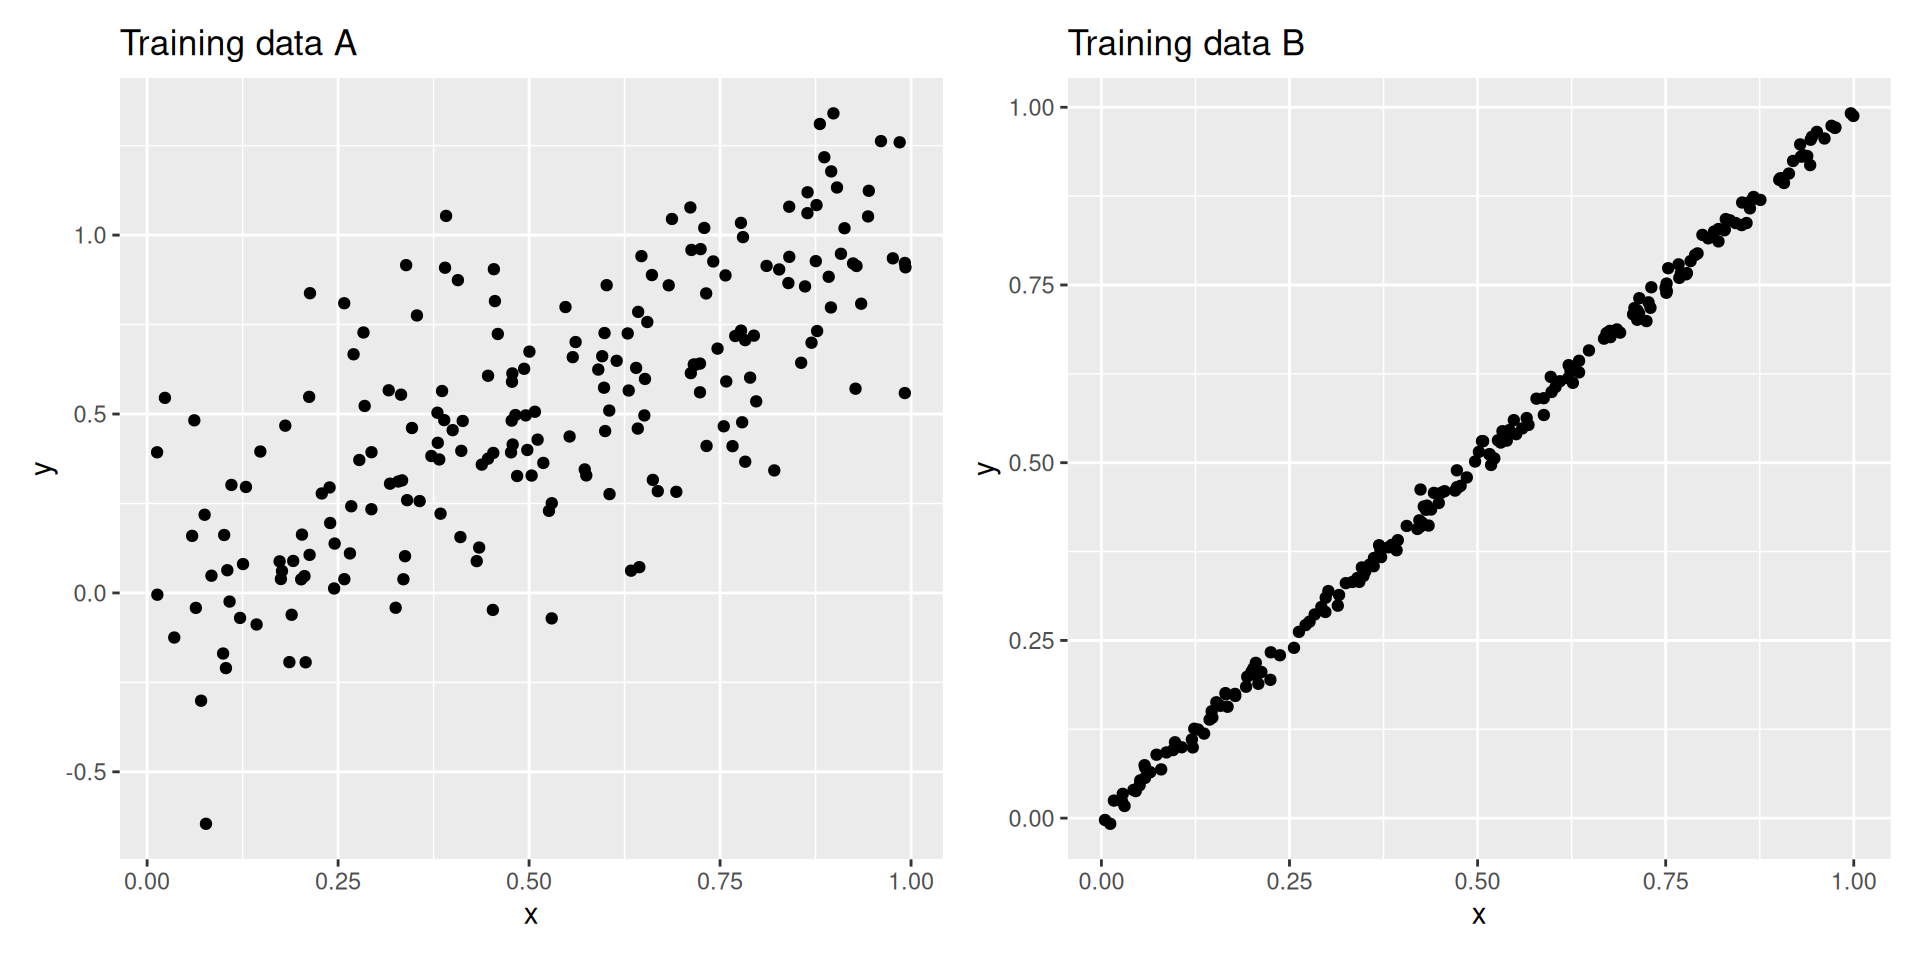
Where is overfitting worse?
01:00
Suppose I overfit my model to the training data. In which scenario (for which training data) would I expect the test set performance to be significantly worse? Assume that the testing sets A and B look like their corresponding training sets.