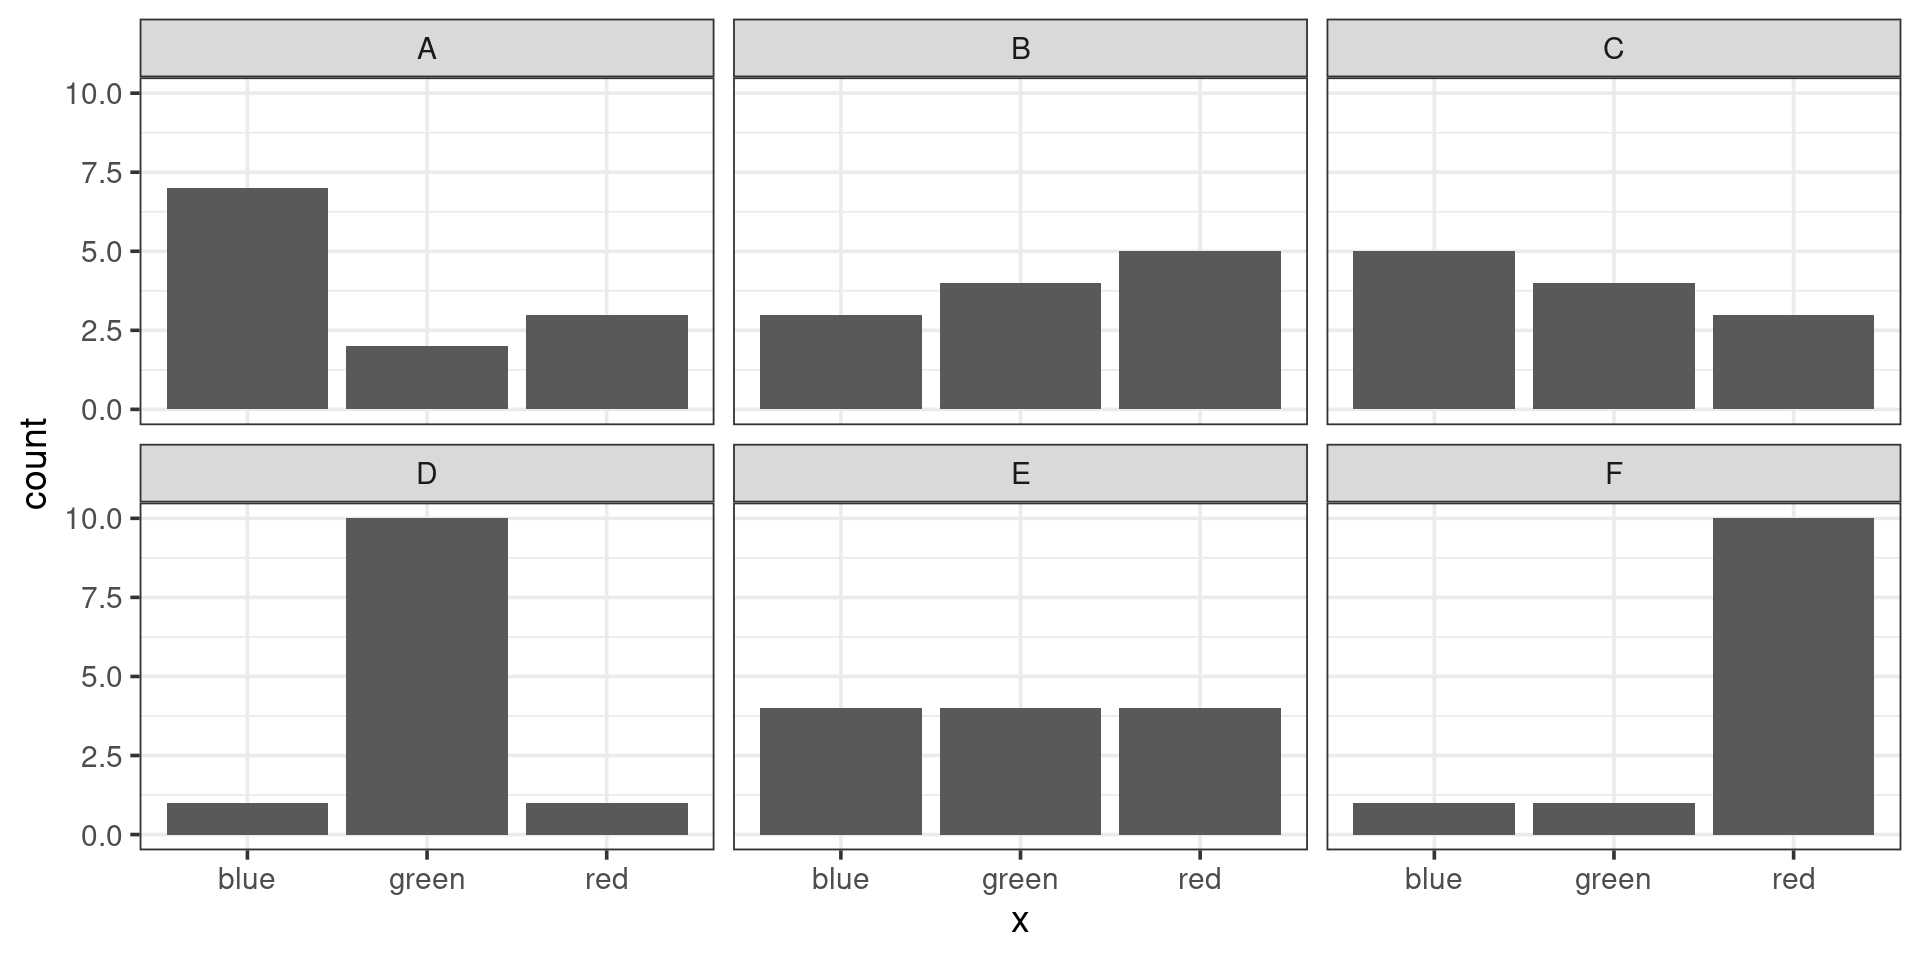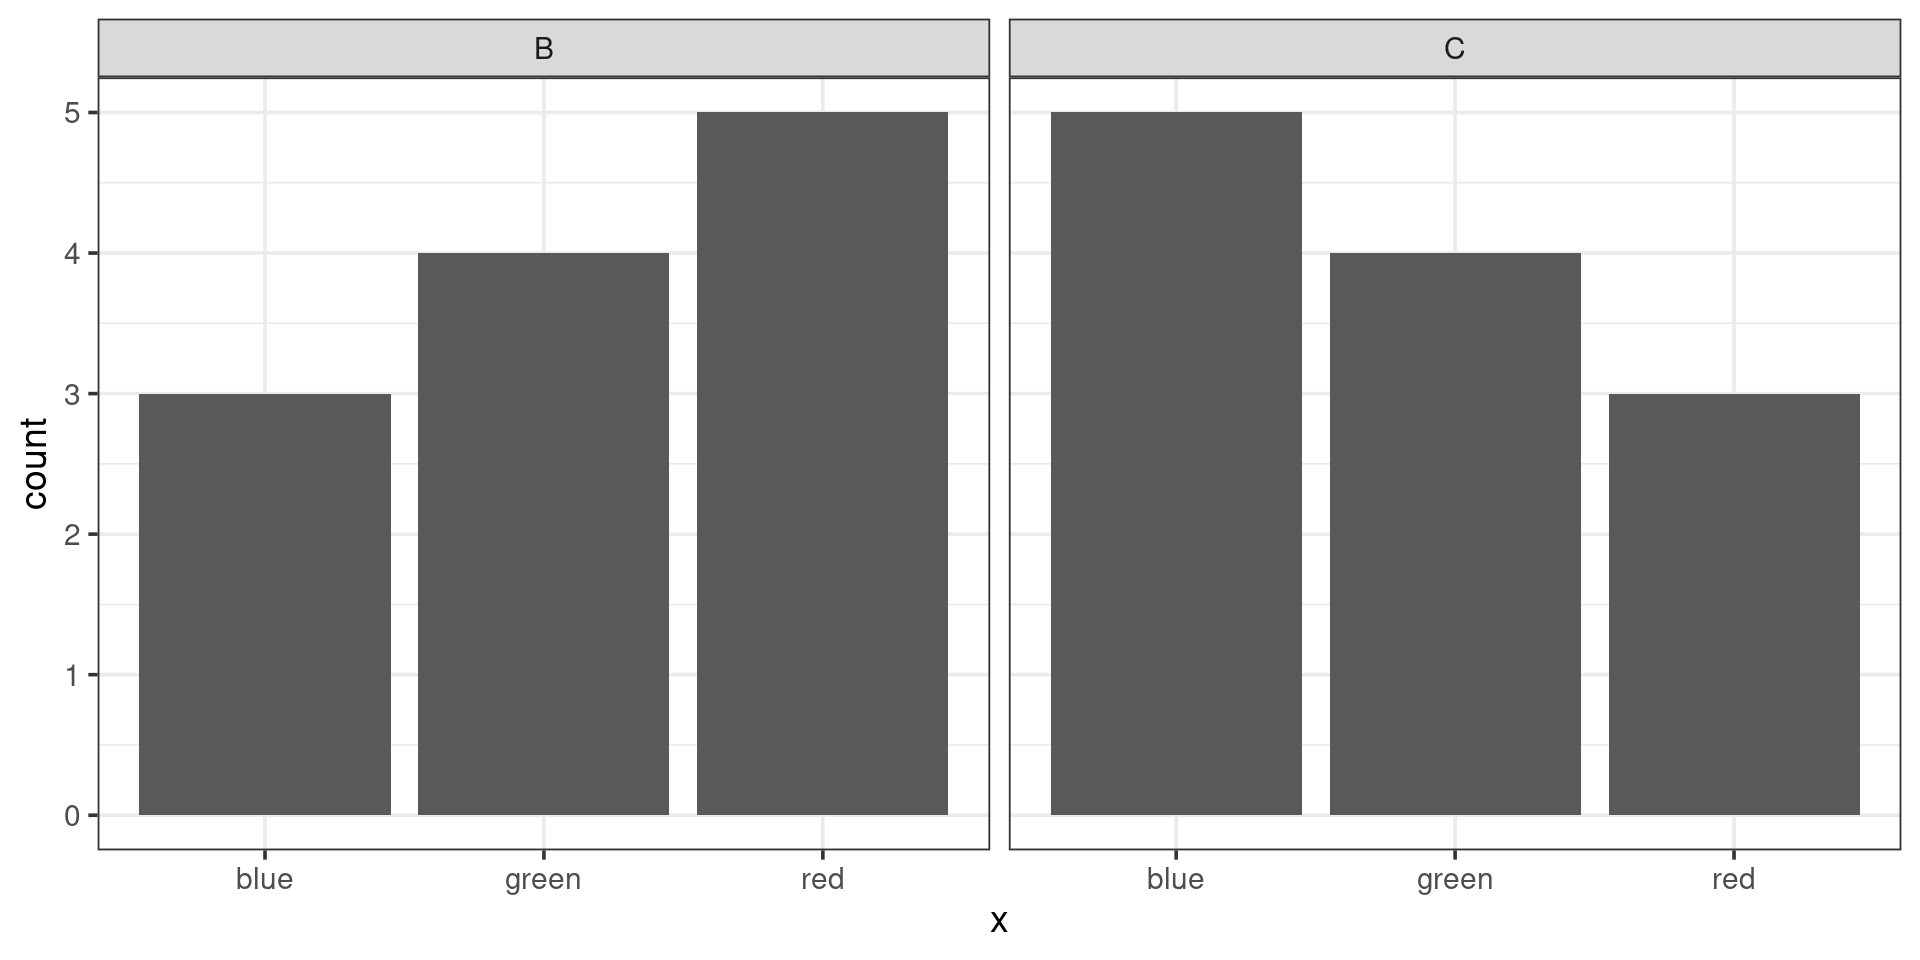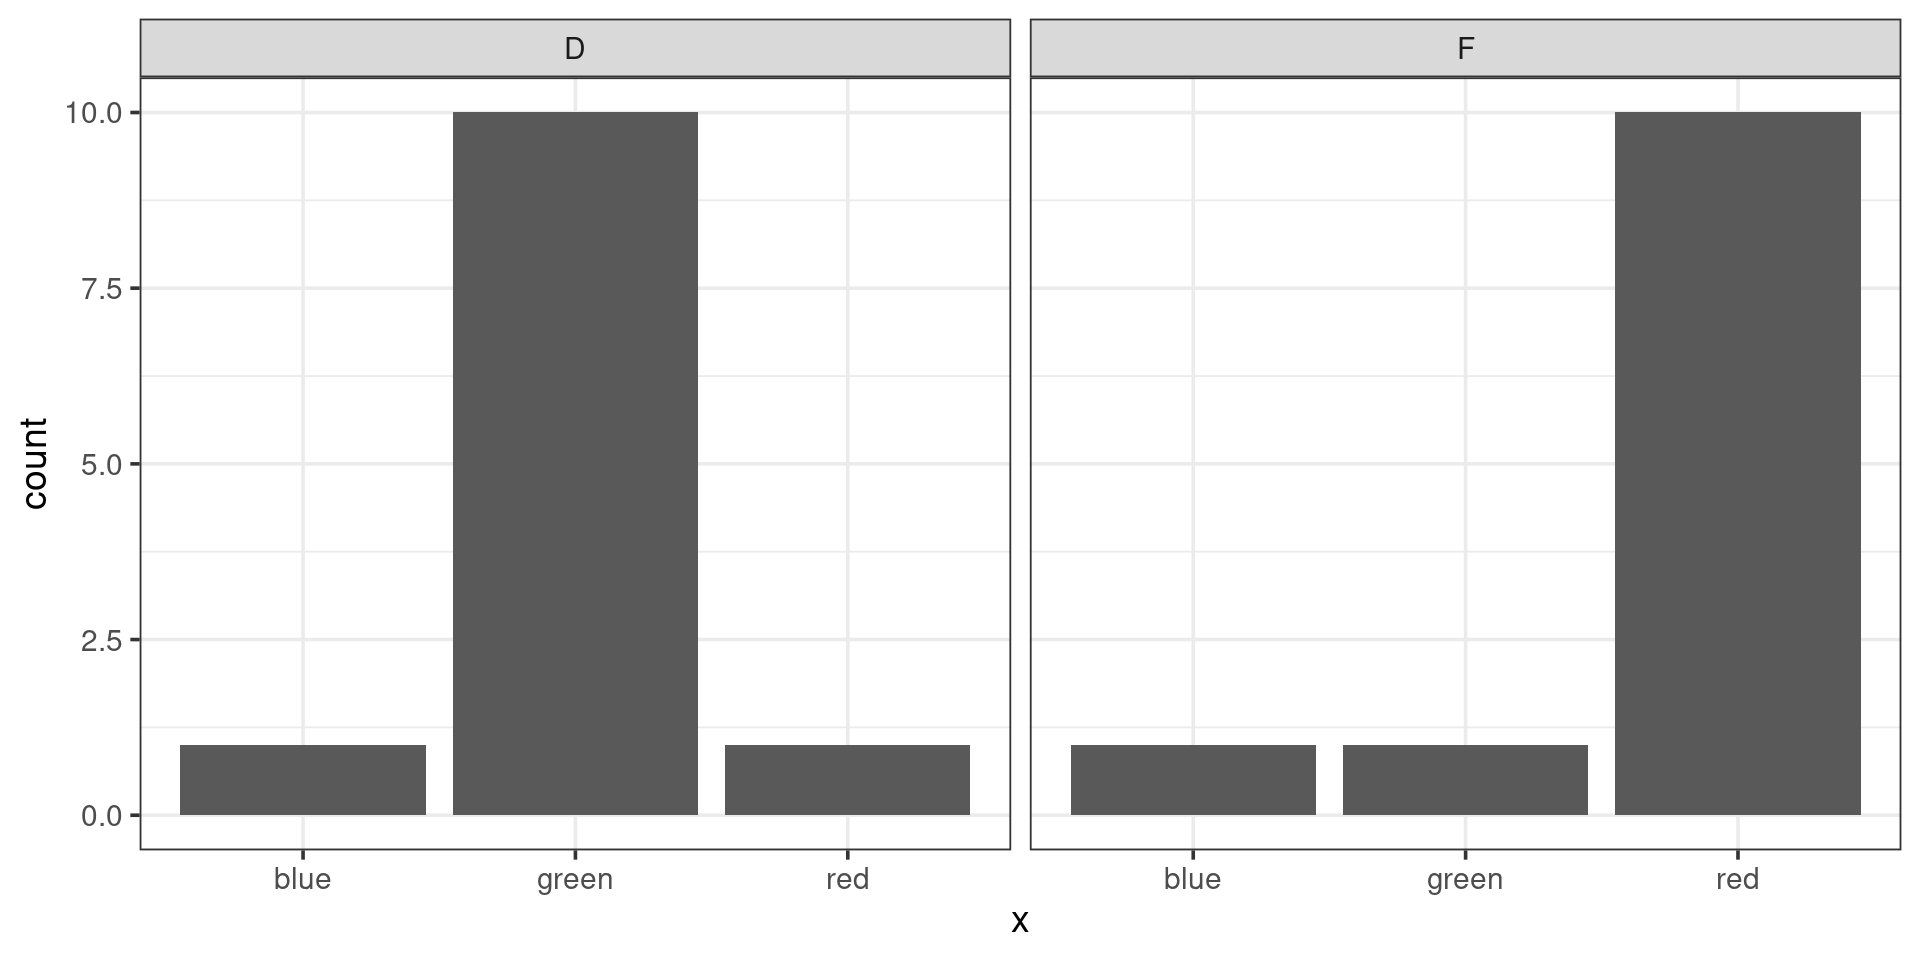
Consider a setting where you have observed data from 120 rolls of a six sided die. The proportion of rolls of each outcome were \(\hat{p}_1 = 0.21\), \(\hat{p}_2 = 0.16\), \(\hat{p}_3 = 0.16\), \(\hat{p}_4 = 0.14\), \(\hat{p}_5 = 0.18\), \(\hat{p}_6 = 0.15\). The proportion of 1s seem a bit high, so you conduct a hypothesis test to determine whether or not this data is consistent with it being a fair six-sided die. Let \(\hat{p}_i\) be the observed proportion of rolls on side \(i\) and let \(p_i\) be the corresponding true probability (a parameter).
01:00
A: Make a box with 6 tickets, each one with a digit 1 through 6 on it. Draw 120 tickets out of it without replacement.
B: Make a box with 6 tickets, each one with a digit 1 through 6 on it. Draw 500 tickets out of it with replacement.
C: Make a box with 6 tickets, each one with a digit 1 through 6 on it. Draw 500 tickets out of it without replacement.
D: Make a box with 6 tickets, each one with a digit 1 through 6 on it. Draw 120 tickets out of it with replacement.
00:40
You calculate one chi-squared statistic per data set (for a total of 500 statistics), and plot a null distribution with these 500 statistics. Your observed chi-squared statistic lies in the center of the null distribution.
00:30
00:30
05:00
40:00
In order to demonstrate how to conduct a hypothesis test through simulation, we will be collecting data from this class using a poll.
You will have only 15 seconds to answer the following multiple choice question, so please get ready at pollev.com…
The two shapes above have simple first names:
Which of the two names belongs to the shape on the left?

00:15
What is a statement of the null hypothesis that corresponds to the notion the link between names and shapes is arbitrary?
01:00
\[\hat{p}_k = \frac{\textrm{Number who chose "Kiki"}}{\textrm{Total number of people}}\]
Note: you could also simply \(n_k\), the number of people who chose “Kiki”.
Our technique: simulate data from a world in which the null is true, then calculate the test statistic on the simulated data.
Which simulation method(s) align with the null hypothesis and our data collection process?
01:00
infer
What is the proper interpretation of this p-value?
01:00