library(tidyverse)
class_survey <- read_csv("class_survey_f26.csv")Class Survey
Get the data into datahub
This semeter’s class survey data will be on Ed under resources (the little download-looking arrow in the top right menu on Ed).
The file name is class_survey_f26.csv. There is also a pdf of the (blank) survey in class_survey_questions_f26.pdf, which you should refer to in order to remember the full question that was being answered. The data has been cleaned and anonymized for you.
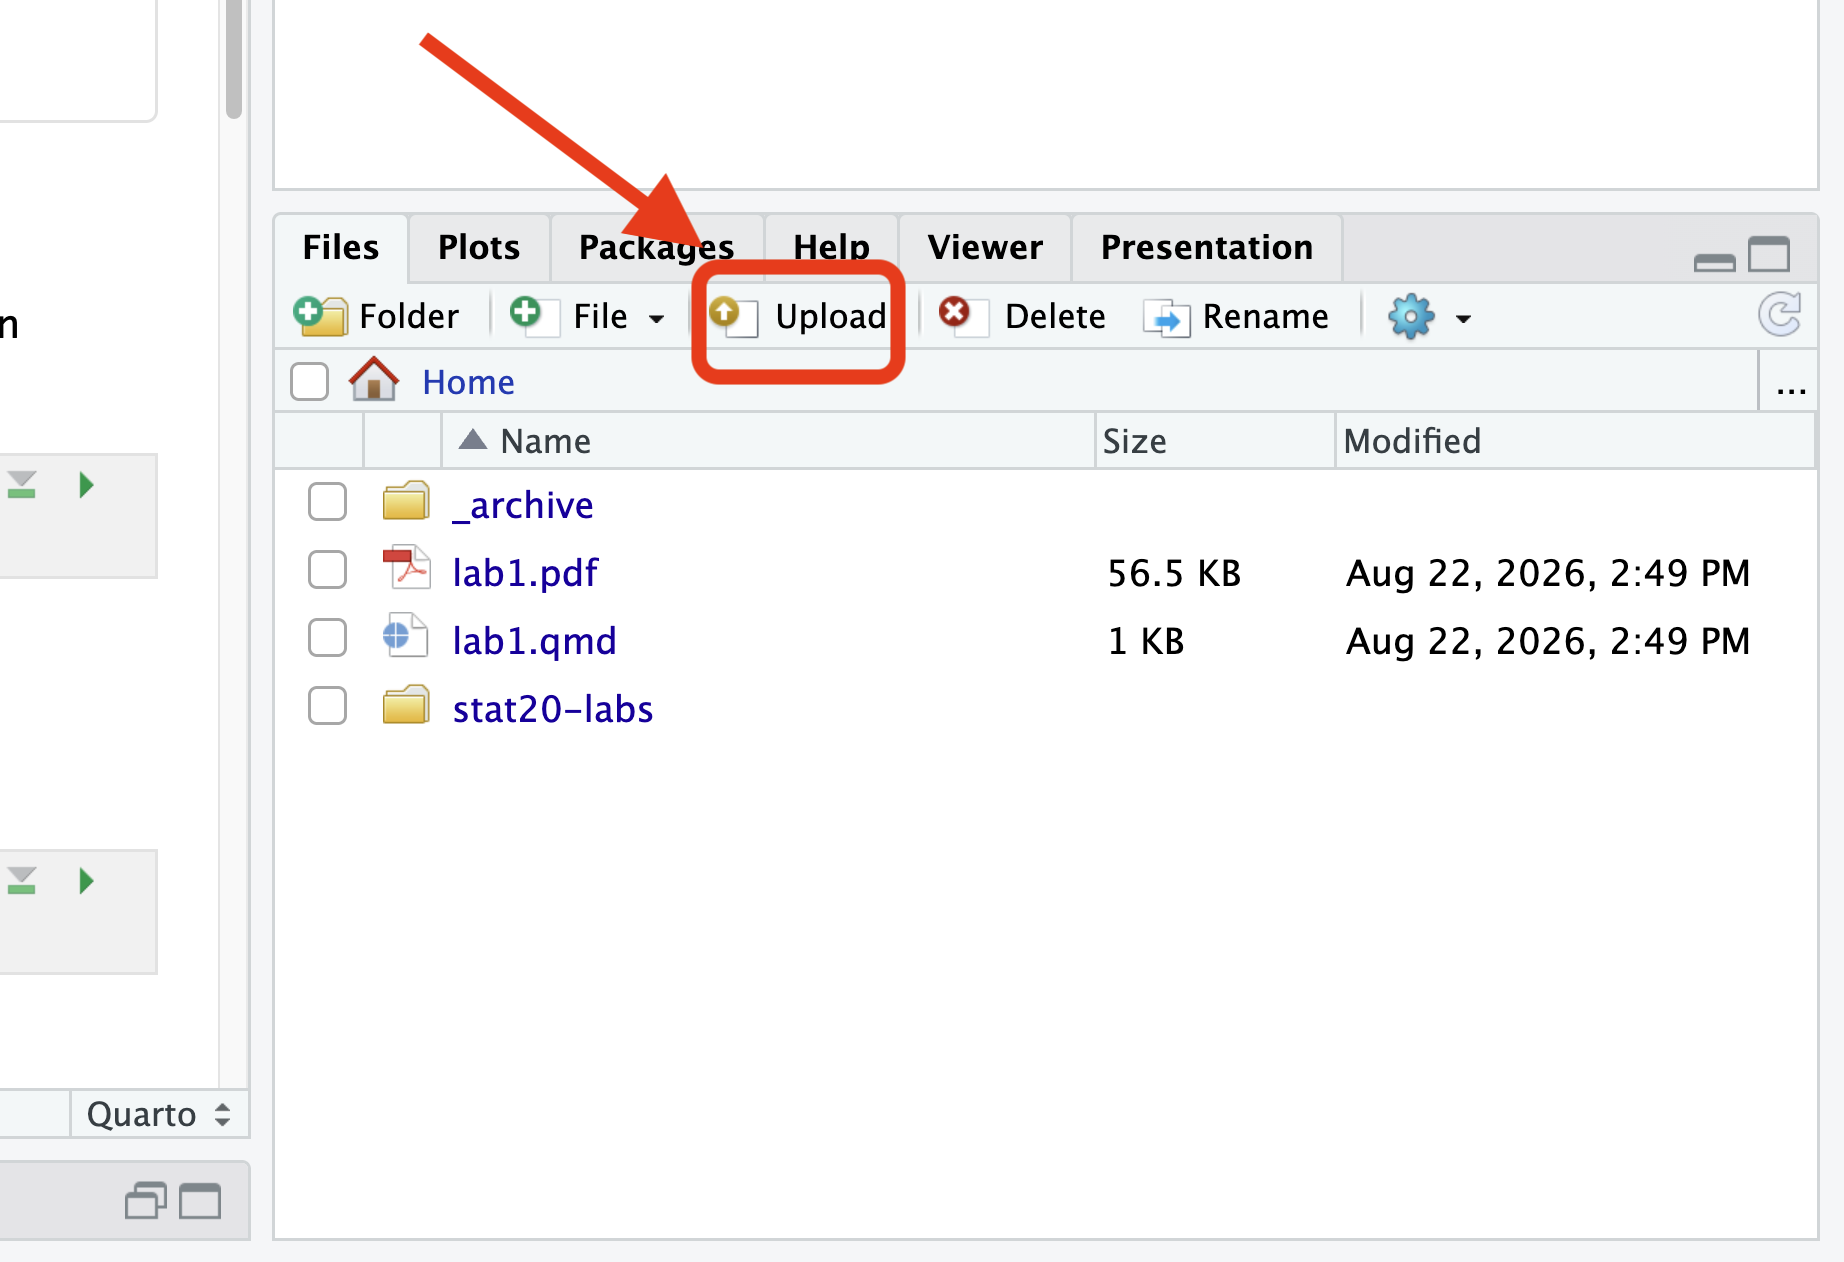
Download the files to your computer. Then, on datahub, in the bottom right, click the “upload” button and upload the csv file.
The Data
To read a dataset from a csv file, use the read_csv function like so:
Important notes:
- We did some data cleaning for you, to keep the text from being too long and annoying to type. So the answer choices, in some cases, won’t exactly match the choices you were presented in the survey.
- We chose column names that were short - not the full question text. You should be able to infer which column corresponds to which question.
Question 1
Look at the PDF of the original survey questions (that you should have downloaded in the instructions earlier…). Use that PDF to help you answer the first two questions.
Part A
What appears to be the data type for the major variable according to the Taxonomy of Data? By “data type” we mean numerical discrete, numerical continuous, categorical nominal, categorical ordinal, or none of these.
Part B
How did you input your major when filling out the survey? Was it a multiple choice question, a drop-down menu, or something else? Explain how this way of recording the major variable may make analysis of any one specific major difficult. Answer in at least two sentences.
Question 2
For this question, we’ll focus on the survey question:
How much do you agree with this statement: “In general, how intimidating/scary is math for you?”
The column name for this variable is math_fear
Imagine you were working with the corresponding variable for this question and wanted to make a one-variable bar chart with it.
Part A
What is the data type for this variable according to the Taxonomy of Data?
Part B
Based on the information on the variable in your environment (click the blue drop down arrow), what is the current class of this variable, according to R?
Part C
Construct a plot that shows how many students chose each answer to this question.
Part D
What looks wrong (or at least unclear) about your plot above?
Part E
Identify another potential class for this variable, according to R, that might be more appropriate based on its data type according to the Taxonomy of Data. You may want to look back at part 3 of the tutorial from last week (in the “Final Lesson” section). Explain your reasoning in at least one sentence. You don’t need to write any code here - we are just looking at the data and thinking about it.
Question 3
Do Stat 20 students prefer to spend time at the beach or in the mountains?
The column name for the relevant question is mts_beach
Part A
Construct a plot that answers this question.
Part B
If you wanted to summarize the “typical” student’s beach-vs-mountains preference, which of the following measures would make the most sense: mean, median, or mode? Explain why in a sentence.
Part C
Then use the plot and this summary to answer, in a sentence, the original question: Do Stat 20 students prefer to spend time at the beach or in the mountains?
Question 4
Is there an association between Stat 20 students’ favorite season and terrain preference (beach or mountains)?
The column name for the “favorite season” question is season
Part A
Construct a plot that answers this question.
Part B
Use this plot to answer the question in one sentence.
Question 5
What do Stat 20 students believe is the chance that a new epidemic disrupts instruction during this semester?
The column name for the relevant question is p_epidemic
Part A
Construct a plot that answers this question.
Part B
Based on the plot, calculate or state the value of a typical observation (mean, median, or mode, as appropriate).
Part C
Use both the plot and the measure of a typical observation to answer the question in one sentence.
Question 6
In terms of their social lives, how satisfied are Stat 20 students with how things are going?
The column name for the relevant question is social_satisfaction
Part A
Construct a bar chart to help answer this question. Because some of the answer options to this variable are lengthy, use the template below to make interpreting the visualization easier.
ggplot(class_survey,
       aes(y = put_the_column_name_here)) +
  geom_bar()
Describe what you see in at least two sentences. Do you notice anything that seems off?
Part B
Based on Question 2 and Question 6a, modify the social satisfaction variable! Hint: you’ll have to use mutate to change the column…
Part C
Then, recreate the plot of Question 6a. Hint: your code should be the same as 6a, but the plot should look different.
Part D
Use your new plot to answer the original question in at least one sentence.
Question 7
Six variables appear in the survey data frame that were derived from the original prof_label question: is_artist, is_humanist, is_nat_sci, is_soc_sci, is_comp_sci and is_entrepreneur. The is_artist variable is TRUE for those students who most identified as an artist and FALSE otherwise. The other five variables are defined similarly.
Part A
Propose your own question involving one of the is_ variables and numerical variable of your choice below.
Part B
Construct a plot that addresses the question.
Part C
Calculate a measure of center for the two groups (“is” and “is not”) separately.
Part D
Use the results of part b and part c to answer your proposed question in at least two sentences.
Question 8
This last one is a full-on choose-your-own adventure!
Part A
Propose your own question involving two or three variables.
Part B
Create a visualization using ggplot2 and answer your question with at least one sentence.
WARNING: Does your rendered pdf have 30+ pages? (And do you want to get credit?)
If your final pdf is really long, you are probably printing an entire dataframe in one of your code cells. For example, a line that just says flights will print the entire flights dataframe (over 100,000 rows!). You don’t realize this, because RStudio is smart enough to hide most of the rows from your screen while you’re working. But when you render, it will obediently print every single row of the dataframe, giving you an unwieldy output.
To fix this, anytime you have a line that is just displaying a dataframe (e.g. just flights), change it to only show the first few rows by using either the head function, e.g. head(flights) or the tidyverse equivalent slice_head(flights, n = 10).
Last Question (don’t forget to answer this!)
Will you ensure that your submission to Gradescope…
- is a pdf generated from a qmd file
- your code is fully visible (not running off the page)
- follows formatting rules (here)
- and assigns each of the questions to all pages that show your work for that question?
(This one is easy! Just answer “yes” or “no”)