Summarizing Categorical Data
What proportion of those students in the marching band were juniors?
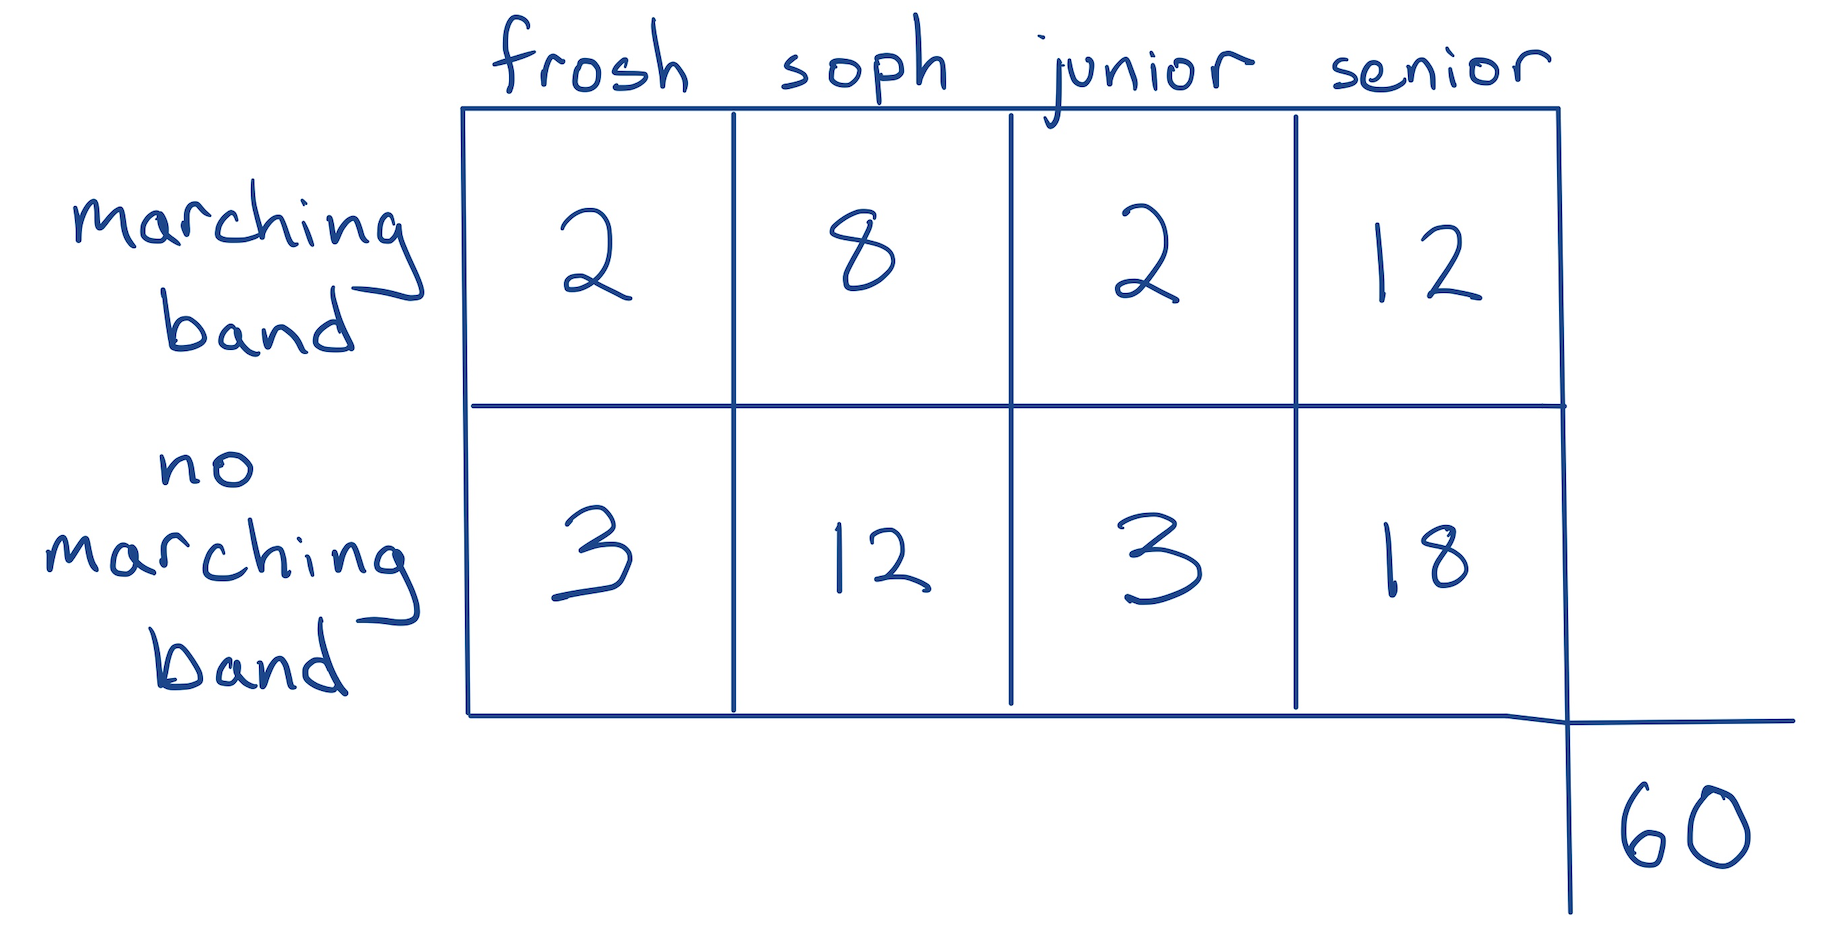
- A. 2/60
- B. 2/5
- C. 2/24
- D. 24/60
01:00
Which group is the largest among these voters?
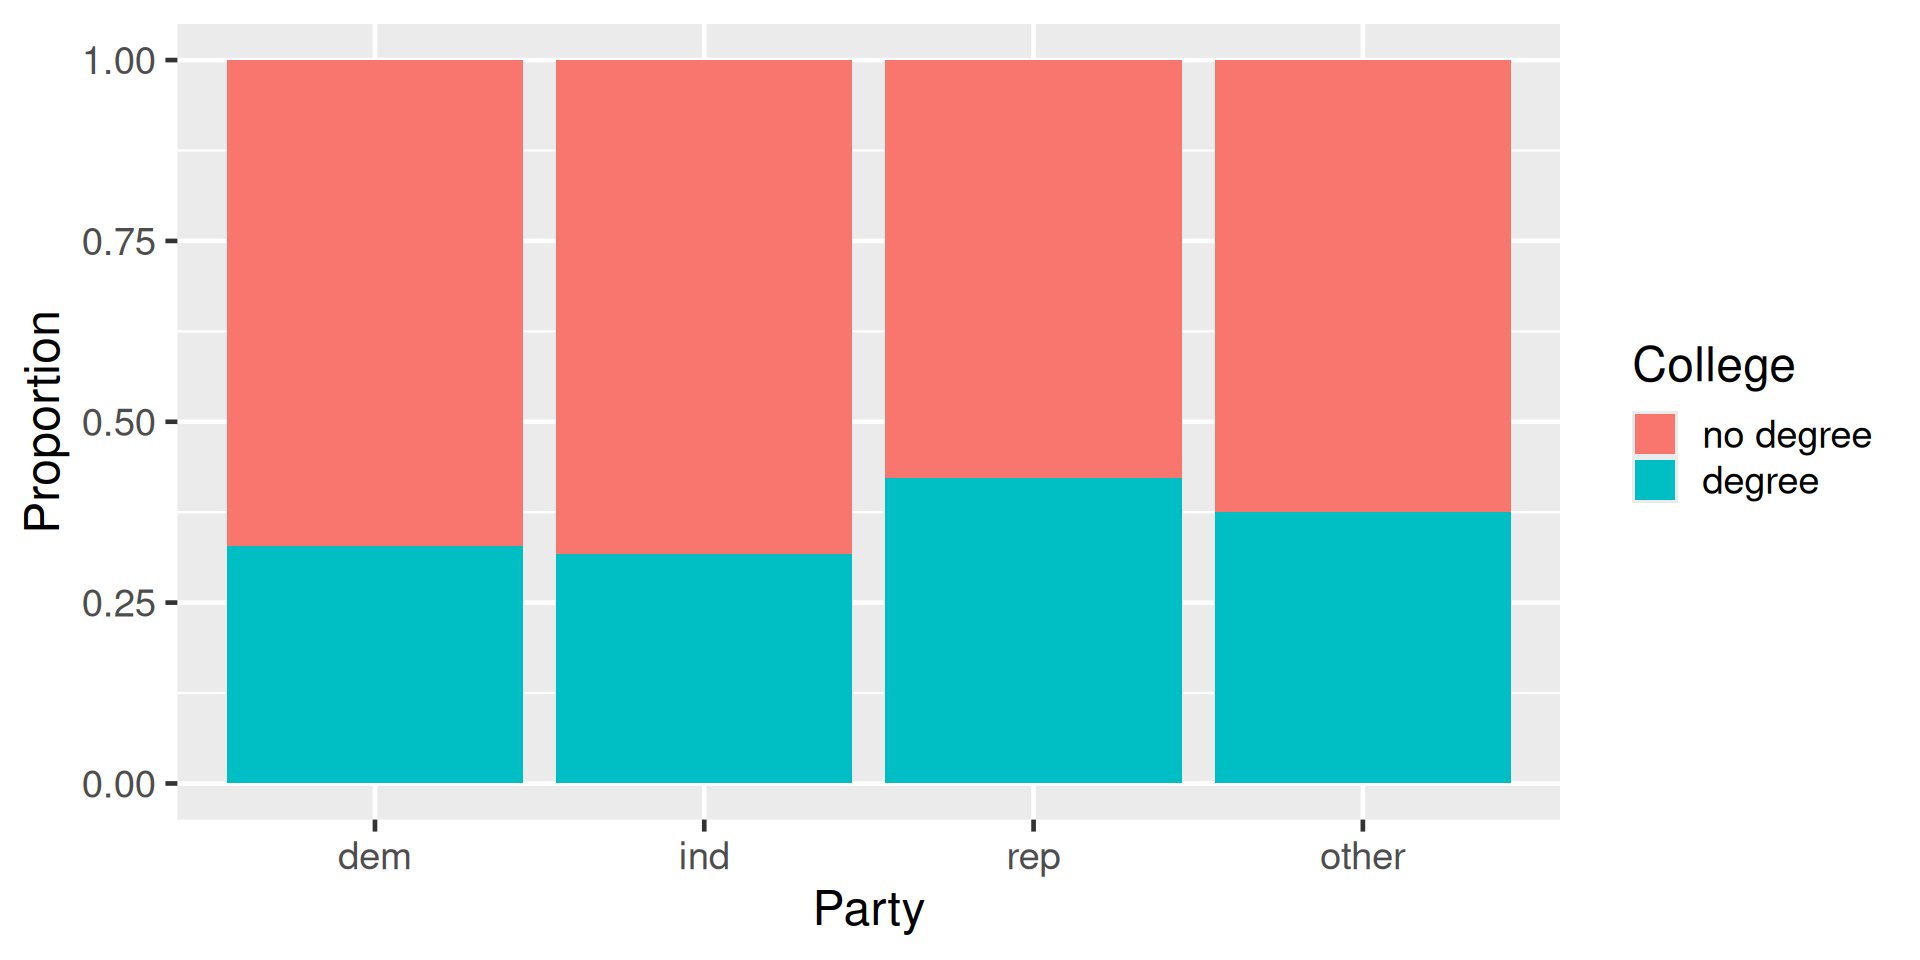
- A. Independents with no degree
- B. Democrats with no degree
- C. Republicans with a degree
- D. We cannot tell with this plot.
00:30
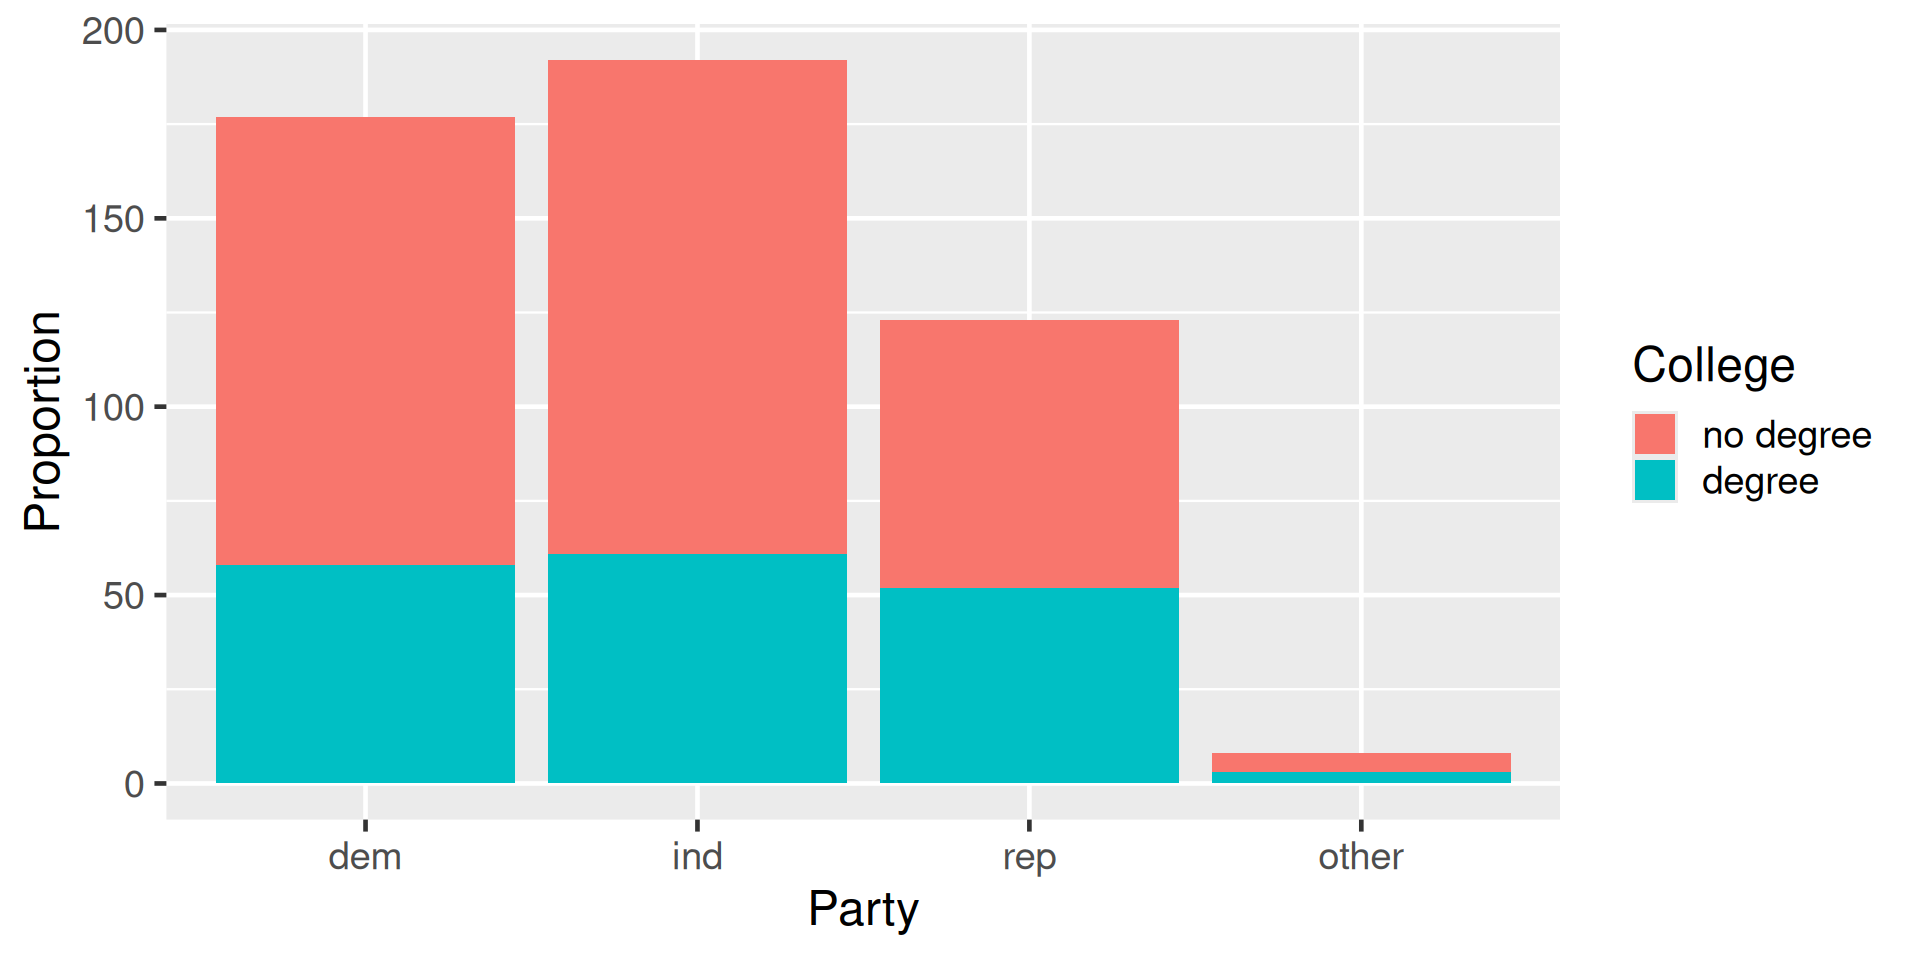
Now we can see which group is largest!
The table below displays data from a survey on a class of students.
What proportion of the class was in the marching band?
00:30
What proportion were sophomores not in the marching band?
00:30
What were the dimensions of the raw data from which this table was constructed?
00:30
How would you characterize the association between these two variables?
00:30